DASHBOARDS
With automated dashboards being made available at your fingertips with the help of our AI analytics, we at MEGAMONIT give you unlimited access to essential business insights and present reports that help your core teams to manage your business in a more prudent manner.
ALERTING
MEGAMONIT helps you to identify and prioritize the actual problems that would be overbearing on your customers in times to come, rather than producing a plethora of unnecessary metrics and overwhelm the process of anomaly detection for the users.
PLUGINS
MEGAMONIT is integrated with various plugins to process human language better and make the content better. It identifies the various groups of information people are looking for, analyzes the content, strives to understand the context behind it and provides a nearly accurate kind of information catering to the customer needs.
Monitoring for Full Stack Environment

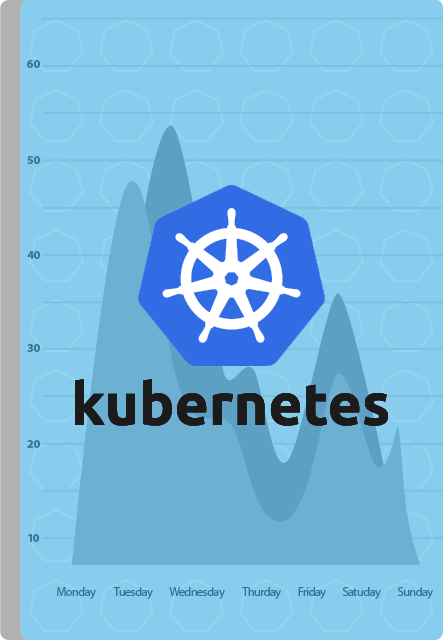
Kubernetes Monitoring supported out of the box

Megmonit agent is purpose-built for containers and supports Docker containers natively. In Kubernetes Megaamonit integrates into the Kubelet binary to-discover all containers in the machine and collects CPU, memory, filesystem, and network usage statistics , also provides the overall machine usage by analyzing the ‘root’ container on the machine.
Read More
Monitoring for Full Stack Environment

Cloud, Coutainer, & Infrastructure Monitoring

➧ Server monitoring ➧ Microservices & container monitoring ➧ Kubernetes Monitoring ➧ Cloud monitoring ➧ Network monitoring ➧ Virtualization monitoring ➧ Log analytics
Read More
Monitoring for Full Stack Environment

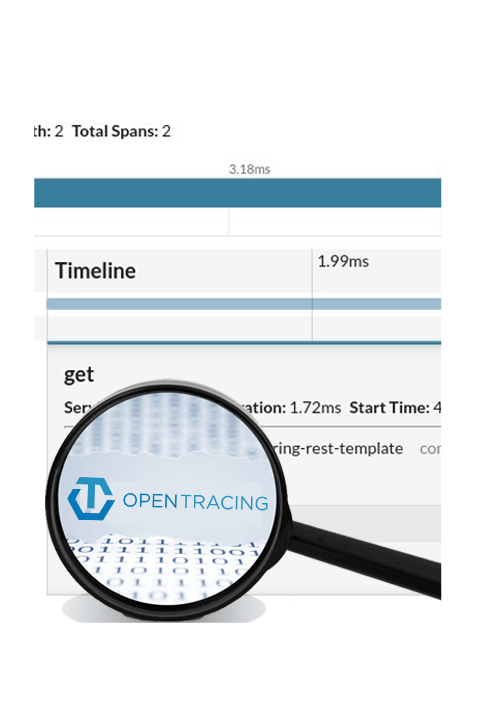
Opentracing compatible libraries

Megamonit with help of opentracing libraries like (Jaeger,Zipkin) will enable you to observe every request at scale. In real-time. Across web, mobile, microservices, and monoliths. Use distributed traces to understand performance problems and identify the teams that can fix them.
Read More
Monitoring for Full Stack Environment

Application Performance & Monitoring

➧ Deep-dive application monitoring ➧ Database monitoring ➧ Continuous delivery analytics ➧ Wire data analytics ➧ Application performance monitoring ➧ Service back trace
Read More
Monitoring for Full Stack Environment

Digital Experience Analytics

➧ Synthetic availability monitoring ➧ Real user monitoring ➧ Mobile app analytics ➧ Business transactions ➧ Connected device experience / IoT
Read More
WATCH THE VIDEO

How the MegaMonit works

“MegaMonit auto-find and benchmark your whole IT eco system , contianers and kubernetes in minutes. Get full bits of knowledge into client experience and business affect .Easily screen and oversee application execution and cloud framework. Resolve application issues before your clients are affected.”

We accelerate innovation and transformation for the biggest and brightest brands.

chat
Digital Experience Analytics & Monitoring
chat
Application Monitoring & Performance Management
image
chat
Cloud, Container, & Infrastructure Monitoring
chat
Integrated with Various Plugins to process
Line of code
Solutions
K+
Active users
K+
Download
MegaMonit is an awesome support for your business
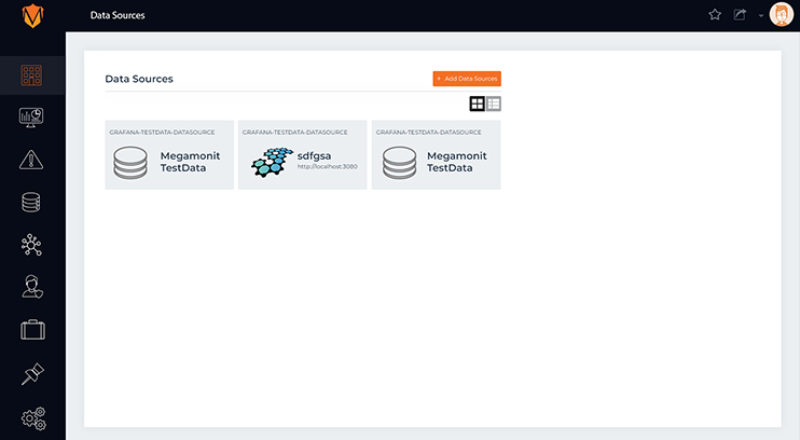
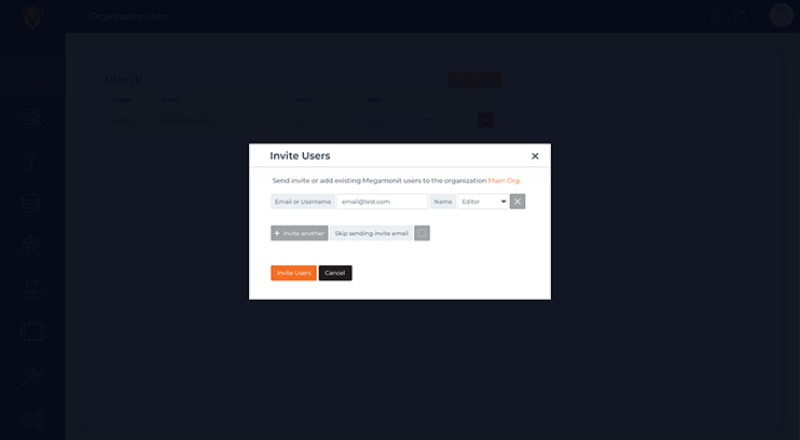
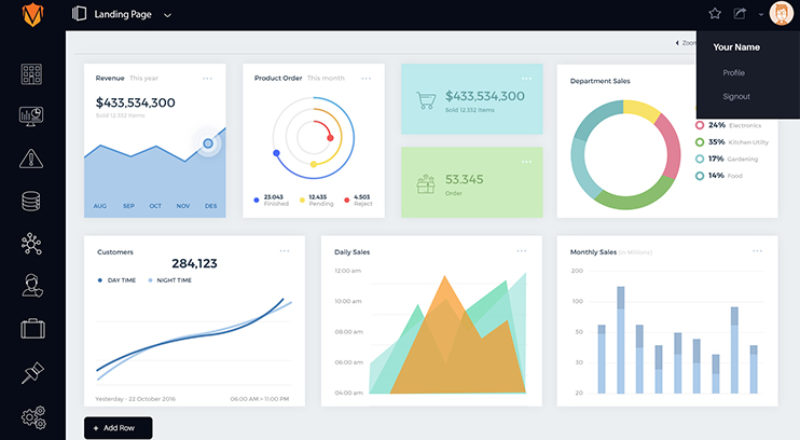
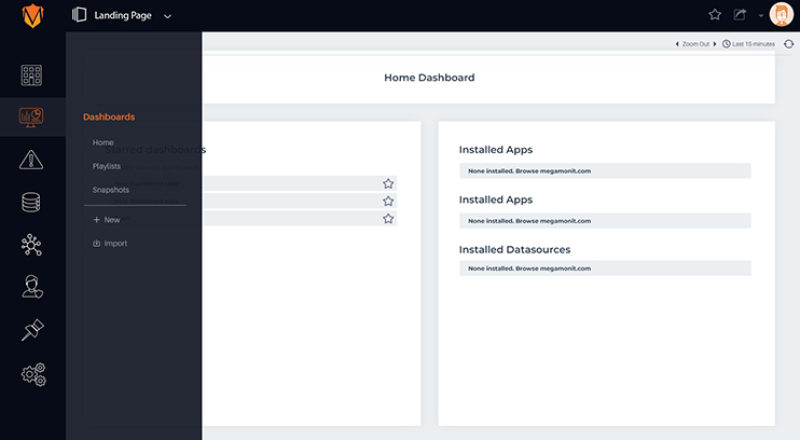
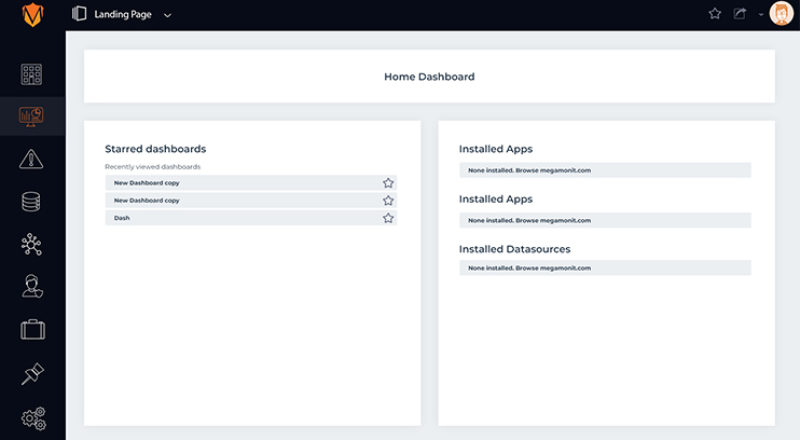
SCREENSHOTS

Beautiful interface

With automated dashboards being made available at your fingertips with the help of our AI analytics, we at MEGAMONIT give you unlimited access to essential business insights and present reports that help your core teams to manage your business in a more prudent manner. MEGAMONIT not only allows you to integrate any level of data easily for effective summarization but our dashboards offer high resolution metrics and events for productive manipulation and efficacious graphing. MEGAMONIT allows you to carefully keep track of the specific data that’s forms to be the most critical performance metrics by segregating it from the whole and creating a custom dashboard for better vigilance. Weempower you by providing the flexibility to create any dashboard with reference to any kind of data without falling into the clutches of codes.

Comparing Over time or Experiment Groups

AppDynamics vs Datadog vs Megamonit Comparison Chart
  • Out of the box Support monitoring for KubernetesOut of the box Support monitoring for Kubernetes
  • Cloud metrics (AWS/GCE/Azure/Rackspace)Cloud metrics (AWS/GCE/Azure/Rackspace)
  • Node level and application level metricsNode level and application level metrics
  • Tracing support using open tracing librariesTracing support using open tracing libraries
  • 100+ turn-key integrations for data aggregation100+ turn-key integrations for data aggregation
  • Clean graphs of StatsD and other integrationsClean graphs of StatsD and other integrations
  • Slice and dice graphs and alerts by tags, roles, and moreSlice and dice graphs and alerts by tags, roles, and more
  • Easy-to-use search for hosts, metrics, and tagsEasy-to-use search for hosts, metrics, and tags
  • Alert notifications via e-mail and PagerDutyAlert notifications via e-mail and PagerDuty
  • Full API accessFull API access
  • Overlay metrics and events across disparate sourcesOverlay metrics and events across disparate sources
  • Out-of-the-box and customizable monitoring dashboardsOut-of-the-box and customizable monitoring dashboards
  • Easy way to compute rates, ratios, averages, or integralsEasy way to compute rates, ratios, averages, or integrals
  • Sampling intervals of 1,5,10 secondsSampling intervals of 1,5,10 seconds
  • a multi-dimensional data model (timeseries defined by metric name and set of key/value dimensions)a multi-dimensional data model (timeseries defined by metric name and set of key/value dimensions)
  • a flexible query language to leverage this dimensionalitya flexible query language to leverage this dimensionality
  • no dependency on distributed storage; single server nodes are autonomousno dependency on distributed storage; single server nodes are autonomous
  • timeseries collection happens via a pull model over HTTPtimeseries collection happens via a pull model over HTTP
  • pushing timeseries is supported via an intermediary gatewaypushing timeseries is supported via an intermediary gateway
  • targets are discovered via service discovery or static configurationtargets are discovered via service discovery or static configuration
  • multiple modes of graphing and dashboarding supportmultiple modes of graphing and dashboarding support
  • support for hierarchical and horizontal federationsupport for hierarchical and horizontal federation
  • Dynamic baselining and powerful alertingDynamic baselining and powerful alerting
  • Visibility and controlVisibility and control
  • Application performance management agentsApplication performance management agents
  • Data retentionData retention
  • Monitor multiple platformsMonitor multiple platforms
  • Troubleshoot performance issues in productionTroubleshoot performance issues in production
  • Trend database performance over timeTrend database performance over time
  • Continuously monitor in a high-volume environmentContinuously monitor in a high-volume environment
  • Install and begin using immediatelyInstall and begin using immediately
  • Database agentsDatabase agents
  • Server VisibilityServer Visibility
  • Synthetic MonitoringSynthetic Monitoring
  • Mute all alerts with 1 click during upgrades and maintenanceMute all alerts with 1 click during upgrades and maintenance
  • Ad-hoc analysis of high-volume dataAd-hoc analysis of high-volume data
  • Can be set up and used entirely in-houseCan be set up and used entirely in-house
  • Centralized data hubCentralized data hub
  • Complex business queries without programming or SQL writingComplex business queries without programming or SQL writing
  • Consolidates, stores, and accumulates dataConsolidates, stores, and accumulates data
  • Drag-and-drop user interfaceDrag-and-drop user interface
  • Intuitive ‘script-less’ user interfaceIntuitive ‘script-less’ user interface
  • Embed entire dashboards or individual widgetsEmbed entire dashboards or individual widgets
  • Enables to deliver interactive terabyte-scale analyticsEnables to deliver interactive terabyte-scale analytics
  • Exports data to CSV, PDF, Excel, Images and other formatsExports data to CSV, PDF, Excel, Images and other formats
  • Eye-grabbing visualizationEye-grabbing visualization
  • Filters data by dropping fields on the canvasFilters data by dropping fields on the canvas
  • Handles data at scale on a single commodity serverHandles data at scale on a single commodity server
  • Identifies critical metrics using filtering, calculationsIdentifies critical metrics using filtering, calculations
  • Integrated data connectors joining multiple data sources and formatsIntegrated data connectors joining multiple data sources and formats
  • Integrates with external web sites or web applicationsIntegrates with external web sites or web applications
  • Integrates with web portalsIntegrates with web portals
  • Interactive browser-based dashboardsInteractive browser-based dashboards
  • Removes limitations to data sizeRemoves limitations to data size
  • Use Single-Sign-On to keep a single authentication mechanismUse Single-Sign-On to keep a single authentication mechanism
  • Wide range of widgets such as gauges, charts, and graphsWide range of widgets such as gauges, charts, and graphs
  • BitiumBitium
  • BoxBox
  • DatadogDatadog
  • DropboxDropbox
  • FacebookFacebook
  • GitHubGitHub
  • Google DriveGoogle Drive
  • HipChatHipChat
  • JIRA SoftwareJIRA Software
  • MailChimpMailChimp
  • NetSuiteNetSuite
  • OpsGenieOpsGenie
  • PagerDutyPagerDuty
  • Salesforce Sales CloudSalesforce Sales Cloud
  • SlackSlack
  • TwilioTwilio
  • TwitterTwitter
  • WorkatoWorkato
  • ZapierZapier
  • ZendeskZendesk
  • Certifications SOC 2Certifications SOC 2
  • Encryption of sensitive data at restEncryption of sensitive data at rest
  • Encryption: HTTPS for all pagesEncryption: HTTPS for all pages
  • Access control: Multi-factor authentication optionsAccess control: Multi-factor authentication options
  • MegaMonit

  • FEATURES

  • Out of the box Support monitoring for Kubernetes
  • Cloud metrics (AWS/GCE/Azure/Rackspace)
  • Node level and application level metrics
  • Tracing support using open tracing libraries
  • 100+ turn-key integrations for data aggregation
  • Clean graphs of StatsD and other integrations
  • Slice and dice graphs and alerts by tags, roles, and more
  • Easy-to-use search for hosts, metrics, and tags
  • Alert notifications via e-mail and PagerDuty
  • Full API access
  • Overlay metrics and events across disparate sources
  • Out-of-the-box and customizable monitoring dashboards
  • Easy way to compute rates, ratios, averages, or integrals
  • Sampling intervals of 1,5,10 seconds
  • a multi-dimensional data model (timeseries defined by metric name and set of key/value dimensions)
  • a flexible query language to leverage this dimensionality
  • no dependency on distributed storage; single server nodes are autonomous
  • timeseries collection happens via a pull model over HTTP
  • pushing timeseries is supported via an intermediary gateway
  • targets are discovered via service discovery or static configuration
  • multiple modes of graphing and dashboarding support
  • support for hierarchical and horizontal federation
  • Dynamic baselining and powerful alerting
  • Visibility and control
  • Application performance management agents
  • Data retention
  • Monitor multiple platforms
  • Troubleshoot performance issues in production
  • Trend database performance over time
  • Continuously monitor in a high-volume environment
  • Install and begin using immediately
  • Database agents
  • Server Visibility
  • Synthetic Monitoring
  • Mute all alerts with 1 click during upgrades and maintenance
  • Ad-hoc analysis of high-volume data
  • Can be set up and used entirely in-house
  • Centralized data hub
  • Complex business queries without programming or SQL writing
  • Consolidates, stores, and accumulates data
  • Drag-and-drop user interface
  • Intuitive ‘script-less’ user interface
  • Embed entire dashboards or individual widgets
  • Enables to deliver interactive terabyte-scale analytics
  • Exports data to CSV, PDF, Excel, Images and other formats
  • Eye-grabbing visualization
  • Filters data by dropping fields on the canvas
  • Handles data at scale on a single commodity server
  • Identifies critical metrics using filtering, calculations
  • Integrated data connectors joining multiple data sources and formats
  • Integrates with external web sites or web applications
  • Integrates with web portals
  • Interactive browser-based dashboards
  • Removes limitations to data size
  • Use Single-Sign-On to keep a single authentication mechanism
  • Wide range of widgets such as gauges, charts, and graphs
  • INTEGRATIONS

  • Bitium
  • Box
  • Datadog
  • Dropbox
  • Facebook
  • GitHub
  • Google Drive
  • HipChat
  • JIRA Software
  • MailChimp
  • NetSuite
  • OpsGenie
  • PagerDuty
  • Salesforce Sales Cloud
  • Slack
  • Twilio
  • Twitter
  • Workato
  • Zapier
  • Zendesk
  • SECURITY

  • Certifications SOC 2
  • Encryption of sensitive data at rest
  • Encryption: HTTPS for all pages
  • Access control: Multi-factor authentication options
  • Competitor-1

  • FEATURES

  • Out of the box Support monitoring for Kubernetes
  • Cloud metrics (AWS/GCE/Azure/Rackspace)
  • Node level and application level metrics
  • Tracing support using open tracing libraries
  • 100+ turn-key integrations for data aggregation
  • Clean graphs of StatsD and other integrations
  • Slice and dice graphs and alerts by tags, roles, and more
  • Easy-to-use search for hosts, metrics, and tags
  • Alert notifications via e-mail and PagerDuty
  • Full API access
  • Overlay metrics and events across disparate sources
  • Out-of-the-box and customizable monitoring dashboards
  • Easy way to compute rates, ratios, averages, or integrals
  • Sampling intervals of 1,5,10 seconds
  • a multi-dimensional data model (timeseries defined by metric name and set of key/value dimensions)
  • a flexible query language to leverage this dimensionality
  • no dependency on distributed storage; single server nodes are autonomous
  • timeseries collection happens via a pull model over HTTP
  • pushing timeseries is supported via an intermediary gateway
  • targets are discovered via service discovery or static configuration
  • multiple modes of graphing and dashboarding support
  • support for hierarchical and horizontal federation
  • Dynamic baselining and powerful alerting
  • Visibility and control
  • Application performance management agents
  • Data retention
  • Monitor multiple platforms
  • Troubleshoot performance issues in production
  • Trend database performance over time
  • Continuously monitor in a high-volume environment
  • Install and begin using immediately
  • Database agents
  • Server Visibility
  • Synthetic Monitoring
  • Mute all alerts with 1 click during upgrades and maintenance
  • Ad-hoc analysis of high-volume data
  • Can be set up and used entirely in-house
  • Centralized data hub
  • Complex business queries without programming or SQL writing
  • Consolidates, stores, and accumulates data
  • Drag-and-drop user interface
  • Intuitive ‘script-less’ user interface
  • Embed entire dashboards or individual widgets
  • Enables to deliver interactive terabyte-scale analytics
  • Exports data to CSV, PDF, Excel, Images and other formats
  • Eye-grabbing visualization
  • Filters data by dropping fields on the canvas
  • Handles data at scale on a single commodity server
  • Identifies critical metrics using filtering, calculations
  • Integrated data connectors joining multiple data sources and formats
  • Integrates with external web sites or web applications
  • Integrates with web portals
  • Interactive browser-based dashboards
  • Removes limitations to data size
  • Use Single-Sign-On to keep a single authentication mechanism
  • Wide range of widgets such as gauges, charts, and graphs
  • INTEGRATIONS

  • Bitium
  • Box
  • Datadog
  • Dropbox
  • Facebook
  • GitHub
  • Google Drive
  • HipChat
  • JIRA Software
  • MailChimp
  • NetSuite
  • OpsGenie
  • PagerDuty
  • Salesforce Sales Cloud
  • Slack
  • Twilio
  • Twitter
  • Workato
  • Zapier
  • Zendesk
  • SECURITY

  • Certifications SOC 2
  • Encryption of sensitive data at rest
  • Encryption: HTTPS for all pages
  • Access control: Multi-factor authentication options
  • Competitor-2

  • FEATURES

  • Out of the box Support monitoring for Kubernetes
  • Cloud metrics (AWS/GCE/Azure/Rackspace)
  • Node level and application level metrics
  • Tracing support using open tracing libraries
  • 100+ turn-key integrations for data aggregation
  • Clean graphs of StatsD and other integrations
  • Slice and dice graphs and alerts by tags, roles, and more
  • Easy-to-use search for hosts, metrics, and tags
  • Alert notifications via e-mail and PagerDuty
  • Full API access
  • Overlay metrics and events across disparate sources
  • Out-of-the-box and customizable monitoring dashboards
  • Easy way to compute rates, ratios, averages, or integrals
  • Sampling intervals of 1,5,10 seconds
  • a multi-dimensional data model (timeseries defined by metric name and set of key/value dimensions)
  • a flexible query language to leverage this dimensionality
  • no dependency on distributed storage; single server nodes are autonomous
  • timeseries collection happens via a pull model over HTTP
  • pushing timeseries is supported via an intermediary gateway
  • targets are discovered via service discovery or static configuration
  • multiple modes of graphing and dashboarding support
  • support for hierarchical and horizontal federation
  • Dynamic baselining and powerful alerting
  • Visibility and control
  • Application performance management agents
  • Data retention
  • Monitor multiple platforms
  • Troubleshoot performance issues in production
  • Trend database performance over time
  • Continuously monitor in a high-volume environment
  • Install and begin using immediately
  • Database agents
  • Server Visibility
  • Synthetic Monitoring
  • Mute all alerts with 1 click during upgrades and maintenance
  • Ad-hoc analysis of high-volume data
  • Can be set up and used entirely in-house
  • Centralized data hub
  • Complex business queries without programming or SQL writing
  • Consolidates, stores, and accumulates data
  • Drag-and-drop user interface
  • Intuitive ‘script-less’ user interface
  • Embed entire dashboards or individual widgets
  • Enables to deliver interactive terabyte-scale analytics
  • Exports data to CSV, PDF, Excel, Images and other formats
  • Eye-grabbing visualization
  • Filters data by dropping fields on the canvas
  • Handles data at scale on a single commodity server
  • Identifies critical metrics using filtering, calculations
  • Integrated data connectors joining multiple data sources and formats
  • Integrates with external web sites or web applications
  • Integrates with web portals
  • Interactive browser-based dashboards
  • Removes limitations to data size
  • Use Single-Sign-On to keep a single authentication mechanism
  • Wide range of widgets such as gauges, charts, and graphs
  • INTEGRATIONS

  • Bitium
  • Box
  • Datadog
  • Dropbox
  • Facebook
  • GitHub
  • Google Drive
  • HipChat
  • JIRA Software
  • MailChimp
  • NetSuite
  • OpsGenie
  • PagerDuty
  • Salesforce Sales Cloud
  • Slack
  • Twilio
  • Twitter
  • Workato
  • Zapier
  • Zendesk
  • SECURITY

  • Certifications SOC 2
  • Encryption of sensitive data at rest
  • Encryption: HTTPS for all pages
  • Access control: Multi-factor authentication options
Click here to expand!Click here to collapse!
  • Out of the box Support monitoring for KubernetesOut of the box Support monitoring for Kubernetes
  • Cloud metrics (AWS/GCE/Azure/Rackspace)Cloud metrics (AWS/GCE/Azure/Rackspace)
  • Node level and application level metricsNode level and application level metrics
  • Tracing support using open tracing librariesTracing support using open tracing libraries
  • 100+ turn-key integrations for data aggregation100+ turn-key integrations for data aggregation
  • Clean graphs of StatsD and other integrationsClean graphs of StatsD and other integrations
  • Slice and dice graphs and alerts by tags, roles, and moreSlice and dice graphs and alerts by tags, roles, and more
  • Easy-to-use search for hosts, metrics, and tagsEasy-to-use search for hosts, metrics, and tags
  • Alert notifications via e-mail and PagerDutyAlert notifications via e-mail and PagerDuty
  • Full API accessFull API access
  • Overlay metrics and events across disparate sourcesOverlay metrics and events across disparate sources
  • Out-of-the-box and customizable monitoring dashboardsOut-of-the-box and customizable monitoring dashboards
  • Easy way to compute rates, ratios, averages, or integralsEasy way to compute rates, ratios, averages, or integrals
  • Sampling intervals of 1,5,10 secondsSampling intervals of 1,5,10 seconds
  • a multi-dimensional data model (timeseries defined by metric name and set of key/value dimensions)a multi-dimensional data model (timeseries defined by metric name and set of key/value dimensions)
  • a flexible query language to leverage this dimensionalitya flexible query language to leverage this dimensionality
  • no dependency on distributed storage; single server nodes are autonomousno dependency on distributed storage; single server nodes are autonomous
  • timeseries collection happens via a pull model over HTTPtimeseries collection happens via a pull model over HTTP
  • pushing timeseries is supported via an intermediary gatewaypushing timeseries is supported via an intermediary gateway
  • targets are discovered via service discovery or static configurationtargets are discovered via service discovery or static configuration
  • multiple modes of graphing and dashboarding supportmultiple modes of graphing and dashboarding support
  • support for hierarchical and horizontal federationsupport for hierarchical and horizontal federation
  • Dynamic baselining and powerful alertingDynamic baselining and powerful alerting
  • Visibility and controlVisibility and control
  • Application performance management agentsApplication performance management agents
  • Data retentionData retention
  • Monitor multiple platformsMonitor multiple platforms
  • Troubleshoot performance issues in productionTroubleshoot performance issues in production
  • Trend database performance over timeTrend database performance over time
  • Continuously monitor in a high-volume environmentContinuously monitor in a high-volume environment
  • Install and begin using immediatelyInstall and begin using immediately
  • Database agentsDatabase agents
  • Server VisibilityServer Visibility
  • Synthetic MonitoringSynthetic Monitoring
  • Mute all alerts with 1 click during upgrades and maintenanceMute all alerts with 1 click during upgrades and maintenance
  • Ad-hoc analysis of high-volume dataAd-hoc analysis of high-volume data
  • Can be set up and used entirely in-houseCan be set up and used entirely in-house
  • Centralized data hubCentralized data hub
  • Complex business queries without programming or SQL writingComplex business queries without programming or SQL writing
  • Consolidates, stores, and accumulates dataConsolidates, stores, and accumulates data
  • Drag-and-drop user interfaceDrag-and-drop user interface
  • Intuitive ‘script-less’ user interfaceIntuitive ‘script-less’ user interface
  • Embed entire dashboards or individual widgetsEmbed entire dashboards or individual widgets
  • Enables to deliver interactive terabyte-scale analyticsEnables to deliver interactive terabyte-scale analytics
  • Exports data to CSV, PDF, Excel, Images and other formatsExports data to CSV, PDF, Excel, Images and other formats
  • Eye-grabbing visualizationEye-grabbing visualization
  • Filters data by dropping fields on the canvasFilters data by dropping fields on the canvas
  • Handles data at scale on a single commodity serverHandles data at scale on a single commodity server
  • Identifies critical metrics using filtering, calculationsIdentifies critical metrics using filtering, calculations
  • Integrated data connectors joining multiple data sources and formatsIntegrated data connectors joining multiple data sources and formats
  • Integrates with external web sites or web applicationsIntegrates with external web sites or web applications
  • Integrates with web portalsIntegrates with web portals
  • Interactive browser-based dashboardsInteractive browser-based dashboards
  • Removes limitations to data sizeRemoves limitations to data size
  • Use Single-Sign-On to keep a single authentication mechanismUse Single-Sign-On to keep a single authentication mechanism
  • Wide range of widgets such as gauges, charts, and graphsWide range of widgets such as gauges, charts, and graphs
  • BitiumBitium
  • BoxBox
  • DatadogDatadog
  • DropboxDropbox
  • FacebookFacebook
  • GitHubGitHub
  • Google DriveGoogle Drive
  • HipChatHipChat
  • JIRA SoftwareJIRA Software
  • MailChimpMailChimp
  • NetSuiteNetSuite
  • OpsGenieOpsGenie
  • PagerDutyPagerDuty
  • Salesforce Sales CloudSalesforce Sales Cloud
  • SlackSlack
  • TwilioTwilio
  • TwitterTwitter
  • WorkatoWorkato
  • ZapierZapier
  • ZendeskZendesk
  • Certifications SOC 2Certifications SOC 2
  • Encryption of sensitive data at restEncryption of sensitive data at rest
  • Encryption: HTTPS for all pagesEncryption: HTTPS for all pages
  • Access control: Multi-factor authentication optionsAccess control: Multi-factor authentication options
  • MegaMonit

  • FEATURES

  • Out of the box Support monitoring for Kubernetes
  • Cloud metrics (AWS/GCE/Azure/Rackspace)
  • Node level and application level metrics
  • Tracing support using open tracing libraries
  • 100+ turn-key integrations for data aggregation
  • Clean graphs of StatsD and other integrations
  • Slice and dice graphs and alerts by tags, roles, and more
  • Easy-to-use search for hosts, metrics, and tags
  • Alert notifications via e-mail and PagerDuty
  • Full API access
  • Overlay metrics and events across disparate sources
  • Out-of-the-box and customizable monitoring dashboards
  • Easy way to compute rates, ratios, averages, or integrals
  • Sampling intervals of 1,5,10 seconds
  • a multi-dimensional data model (timeseries defined by metric name and set of key/value dimensions)
  • a flexible query language to leverage this dimensionality
  • no dependency on distributed storage; single server nodes are autonomous
  • timeseries collection happens via a pull model over HTTP
  • pushing timeseries is supported via an intermediary gateway
  • targets are discovered via service discovery or static configuration
  • multiple modes of graphing and dashboarding support
  • support for hierarchical and horizontal federation
  • Dynamic baselining and powerful alerting
  • Visibility and control
  • Application performance management agents
  • Data retention
  • Monitor multiple platforms
  • Troubleshoot performance issues in production
  • Trend database performance over time
  • Continuously monitor in a high-volume environment
  • Install and begin using immediately
  • Database agents
  • Server Visibility
  • Synthetic Monitoring
  • Mute all alerts with 1 click during upgrades and maintenance
  • Ad-hoc analysis of high-volume data
  • Can be set up and used entirely in-house
  • Centralized data hub
  • Complex business queries without programming or SQL writing
  • Consolidates, stores, and accumulates data
  • Drag-and-drop user interface
  • Intuitive ‘script-less’ user interface
  • Embed entire dashboards or individual widgets
  • Enables to deliver interactive terabyte-scale analytics
  • Exports data to CSV, PDF, Excel, Images and other formats
  • Eye-grabbing visualization
  • Filters data by dropping fields on the canvas
  • Handles data at scale on a single commodity server
  • Identifies critical metrics using filtering, calculations
  • Integrated data connectors joining multiple data sources and formats
  • Integrates with external web sites or web applications
  • Integrates with web portals
  • Interactive browser-based dashboards
  • Removes limitations to data size
  • Use Single-Sign-On to keep a single authentication mechanism
  • Wide range of widgets such as gauges, charts, and graphs
  • INTEGRATIONS

  • Bitium
  • Box
  • Datadog
  • Dropbox
  • Facebook
  • GitHub
  • Google Drive
  • HipChat
  • JIRA Software
  • MailChimp
  • NetSuite
  • OpsGenie
  • PagerDuty
  • Salesforce Sales Cloud
  • Slack
  • Twilio
  • Twitter
  • Workato
  • Zapier
  • Zendesk
  • SECURITY

  • Certifications SOC 2
  • Encryption of sensitive data at rest
  • Encryption: HTTPS for all pages
  • Access control: Multi-factor authentication options
  • AppDynamics

  • FEATURES

  • Out of the box Support monitoring for Kubernetes
  • Cloud metrics (AWS/GCE/Azure/Rackspace)
  • Node level and application level metrics
  • Tracing support using open tracing libraries
  • 100+ turn-key integrations for data aggregation
  • Clean graphs of StatsD and other integrations
  • Slice and dice graphs and alerts by tags, roles, and more
  • Easy-to-use search for hosts, metrics, and tags
  • Alert notifications via e-mail and PagerDuty
  • Full API access
  • Overlay metrics and events across disparate sources
  • Out-of-the-box and customizable monitoring dashboards
  • Easy way to compute rates, ratios, averages, or integrals
  • Sampling intervals of 1,5,10 seconds
  • a multi-dimensional data model (timeseries defined by metric name and set of key/value dimensions)
  • a flexible query language to leverage this dimensionality
  • no dependency on distributed storage; single server nodes are autonomous
  • timeseries collection happens via a pull model over HTTP
  • pushing timeseries is supported via an intermediary gateway
  • targets are discovered via service discovery or static configuration
  • multiple modes of graphing and dashboarding support
  • support for hierarchical and horizontal federation
  • Dynamic baselining and powerful alerting
  • Visibility and control
  • Application performance management agents
  • Data retention
  • Monitor multiple platforms
  • Troubleshoot performance issues in production
  • Trend database performance over time
  • Continuously monitor in a high-volume environment
  • Install and begin using immediately
  • Database agents
  • Server Visibility
  • Synthetic Monitoring
  • Mute all alerts with 1 click during upgrades and maintenance
  • Ad-hoc analysis of high-volume data
  • Can be set up and used entirely in-house
  • Centralized data hub
  • Complex business queries without programming or SQL writing
  • Consolidates, stores, and accumulates data
  • Drag-and-drop user interface
  • Intuitive ‘script-less’ user interface
  • Embed entire dashboards or individual widgets
  • Enables to deliver interactive terabyte-scale analytics
  • Exports data to CSV, PDF, Excel, Images and other formats
  • Eye-grabbing visualization
  • Filters data by dropping fields on the canvas
  • Handles data at scale on a single commodity server
  • Identifies critical metrics using filtering, calculations
  • Integrated data connectors joining multiple data sources and formats
  • Integrates with external web sites or web applications
  • Integrates with web portals
  • Interactive browser-based dashboards
  • Removes limitations to data size
  • Use Single-Sign-On to keep a single authentication mechanism
  • Wide range of widgets such as gauges, charts, and graphs
  • INTEGRATIONS

  • Bitium
  • Box
  • Datadog
  • Dropbox
  • Facebook
  • GitHub
  • Google Drive
  • HipChat
  • JIRA Software
  • MailChimp
  • NetSuite
  • OpsGenie
  • PagerDuty
  • Salesforce Sales Cloud
  • Slack
  • Twilio
  • Twitter
  • Workato
  • Zapier
  • Zendesk
  • SECURITY

  • Certifications SOC 2
  • Encryption of sensitive data at rest
  • Encryption: HTTPS for all pages
  • Access control: Multi-factor authentication options
  • Datadog

  • FEATURES

  • Out of the box Support monitoring for Kubernetes
  • Cloud metrics (AWS/GCE/Azure/Rackspace)
  • Node level and application level metrics
  • Tracing support using open tracing libraries
  • 100+ turn-key integrations for data aggregation
  • Clean graphs of StatsD and other integrations
  • Slice and dice graphs and alerts by tags, roles, and more
  • Easy-to-use search for hosts, metrics, and tags
  • Alert notifications via e-mail and PagerDuty
  • Full API access
  • Overlay metrics and events across disparate sources
  • Out-of-the-box and customizable monitoring dashboards
  • Easy way to compute rates, ratios, averages, or integrals
  • Sampling intervals of 1,5,10 seconds
  • a multi-dimensional data model (timeseries defined by metric name and set of key/value dimensions)
  • a flexible query language to leverage this dimensionality
  • no dependency on distributed storage; single server nodes are autonomous
  • timeseries collection happens via a pull model over HTTP
  • pushing timeseries is supported via an intermediary gateway
  • targets are discovered via service discovery or static configuration
  • multiple modes of graphing and dashboarding support
  • support for hierarchical and horizontal federation
  • Dynamic baselining and powerful alerting
  • Visibility and control
  • Application performance management agents
  • Data retention
  • Monitor multiple platforms
  • Troubleshoot performance issues in production
  • Trend database performance over time
  • Continuously monitor in a high-volume environment
  • Install and begin using immediately
  • Database agents
  • Server Visibility
  • Synthetic Monitoring
  • Mute all alerts with 1 click during upgrades and maintenance
  • Ad-hoc analysis of high-volume data
  • Can be set up and used entirely in-house
  • Centralized data hub
  • Complex business queries without programming or SQL writing
  • Consolidates, stores, and accumulates data
  • Drag-and-drop user interface
  • Intuitive ‘script-less’ user interface
  • Embed entire dashboards or individual widgets
  • Enables to deliver interactive terabyte-scale analytics
  • Exports data to CSV, PDF, Excel, Images and other formats
  • Eye-grabbing visualization
  • Filters data by dropping fields on the canvas
  • Handles data at scale on a single commodity server
  • Identifies critical metrics using filtering, calculations
  • Integrated data connectors joining multiple data sources and formats
  • Integrates with external web sites or web applications
  • Integrates with web portals
  • Interactive browser-based dashboards
  • Removes limitations to data size
  • Use Single-Sign-On to keep a single authentication mechanism
  • Wide range of widgets such as gauges, charts, and graphs
  • INTEGRATIONS

  • Bitium
  • Box
  • Datadog
  • Dropbox
  • Facebook
  • GitHub
  • Google Drive
  • HipChat
  • JIRA Software
  • MailChimp
  • NetSuite
  • OpsGenie
  • PagerDuty
  • Salesforce Sales Cloud
  • Slack
  • Twilio
  • Twitter
  • Workato
  • Zapier
  • Zendesk
  • SECURITY

  • Certifications SOC 2
  • Encryption of sensitive data at rest
  • Encryption: HTTPS for all pages
  • Access control: Multi-factor authentication options
Click here to expand!Click here to collapse!

MegaMonit Pricing

Sign up for MEGAMONIT digital performance monitoring & management service today! Contact for your 15-day free trial.
Send a Message
Translate »